B cell receptors: a grand and beautiful evolutionary process
Frederick “Erick” Matsen
Fred Hutchinson Cancer Research Center
http://matsen.group/
@ematsen
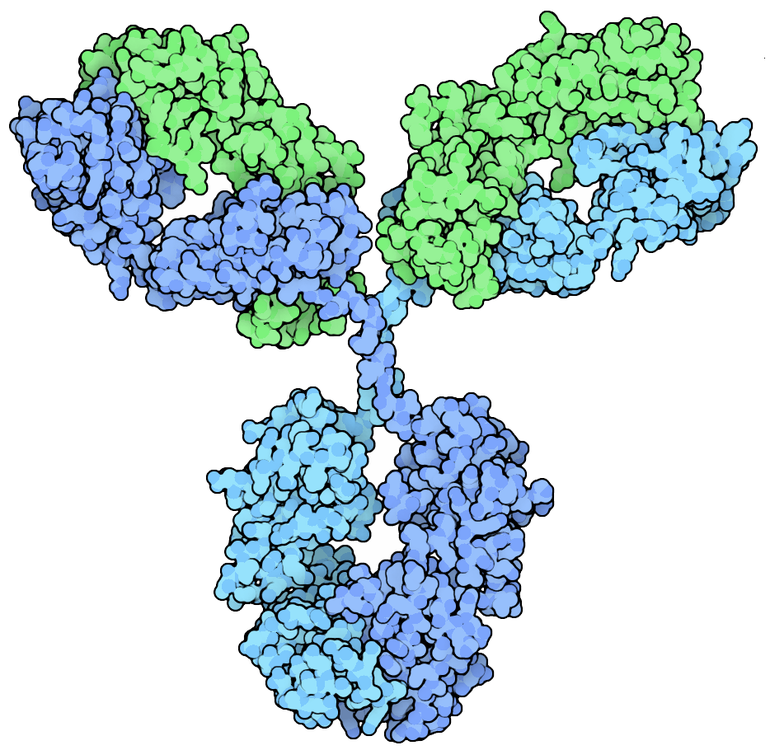
Antibodies bind antigens

Too many antigens to code for directly

B cell diversification process

You have an enzyme which incorporates random nucleotides into your genome.
It’s called Terminal deoxynucleotidyl transferase or TdT.
You have an enzyme which is purpose-built to randomly mutate your genome.
It’s called Activation-Induced Deaminase or AID.
We can sequence BCRs in high throughput

Determining homology is hard!

The mutation process is crazy!

High context-sensitivity of mutation

Big, beautiful, messy data for the study of evolution
We don’t need lots of little techniques…
we only need models and one principle: likelihood.
How can we learn using probabilistic models?
HMM intro: dishonest casino

HMM intro: dishonest casino

HMM intro: dishonest casino

HMM intro: dishonest casino


Generative probabilistic model \(\rightarrow\) inference
-
Develop probabilistic model of biological process and how data is generated.
-
Find parameter choices that maximize the likelihood of generating the observed data.
When a field of bioinformatics is mature, it becomes statistics.
E.g. Maximum-likelihood phylogenetics, HMMER, DESeq2, etc.
VDJ rearrangement


Biased die roll \(\leftrightarrow\) read base (under mutation)
Switching dice \(\leftrightarrow\) changing between V, D, J genes


VDJ annotation problem: from where did each nucleotide come?
A: Take maximum-likelihood HMM path.
Find clonal families

Find clonal families
Did two sequences come from the same VDJ recombination?
Say we are given two sequences

Double roll \(\leftrightarrow\) Pair HMM

Double roll \(\leftrightarrow\) Pair HMM
Pick double roll hypothesis if it has higher likelihood of generating data.

(But we only know the sequences, not the annotations!)
Do two sequences come from a single rearrangement event?
Probability of generating observed sequence \(x\) from HMM:
\[
\mathbb P(x) = \sum_{\text{paths}\ \sigma} \mathbb P(x;\sigma),
\]
Probability of generating two sequences \(x\) and \(y\) from the same path through the HMM (i.e. from the same rearrangement event):
\[
\mathbb P(x,y) = \sum_{\text{paths}\ \sigma} \mathbb P(x,y;\sigma),
\]
\[
\text{Calculate: } \frac{\mathbb P(x, y)}{\mathbb P(x) \mathbb P(y)} = \frac{\mathbb P(\text{single rearrangement})}{\mathbb P(\text{independent rearrangements})}
\]
Do sets of sequences come from a
single rearrangement event?
\[
\frac{\mathbb P(A \cup B)}{\mathbb P(A) \mathbb P(B)} = \frac{\mathbb P(A \cup B \ | \ \text{single rearrangement})}{\mathbb P(A,B \ | \ \text{independent rearrangements})}
\]
Use this for agglomerative clustering; stop when the ratio < 1.

What are probabilities?
Distributions are reproducibly weird!

Distributions are reproducibly weird!


Sparse data & ML parameter inference
can be dangerous
Say we are flipping a coin with probability \(p\) of giving heads:
\[
\Pr(X=k)={\binom {n}{k}}p^{k}(1-p)^{n-k}
\]
Introductory aside: Bayesian estimation
Priors guide parameter inferences in the
absence of evidence to the contrary.
How to regularize per site?
Highly observed sites inform estimation for rarely observed ones.

–>
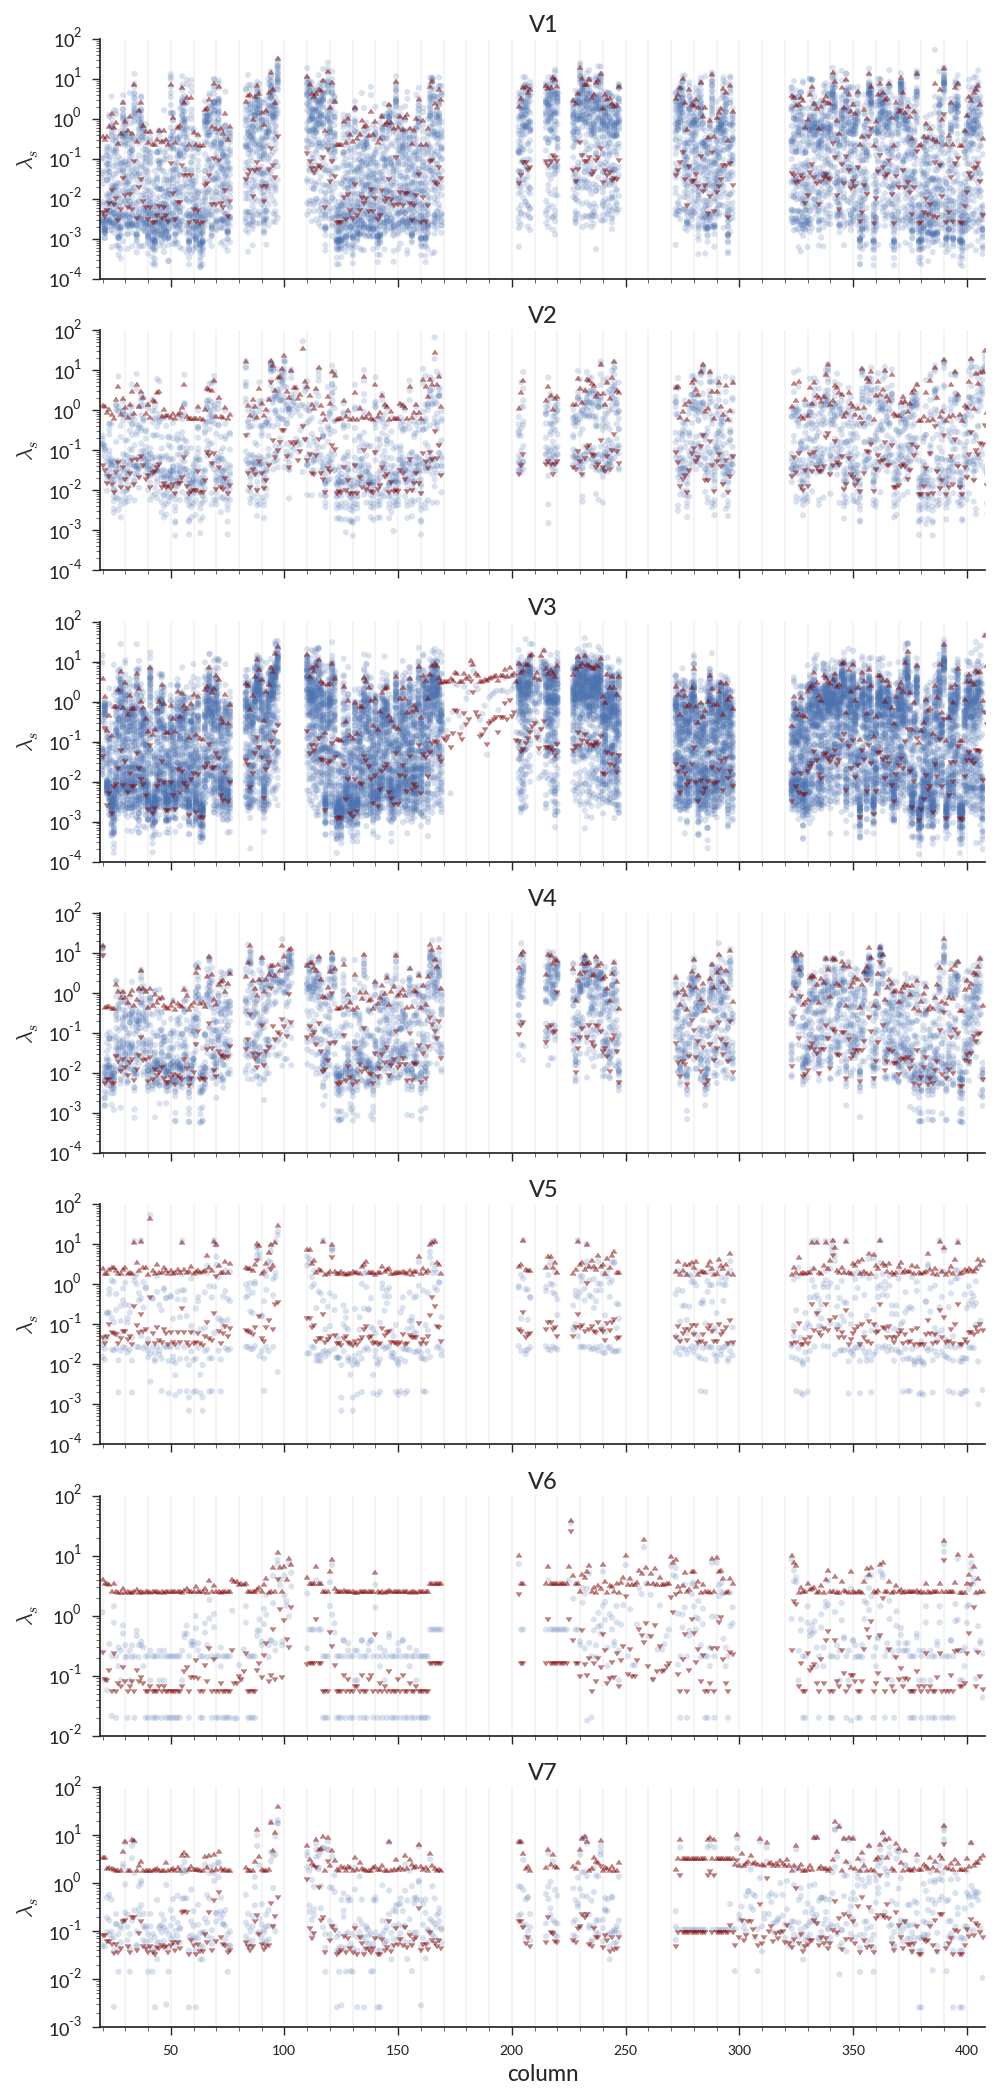
Per-site rate estimates for 1 individual

data from Stern, Yaari, Heiden … O’Connor (2014). B cells populating the multiple sclerosis brain mature in the draining cervical lymph nodes. Science Trans Med, 6(248), 248ra107.
Per-column mutation prior mean

Per-column mutation prior mean

Between-individual consistency (thickness)

Per-site prior mean between individuals

Natural selection inference

Would like per-site selection inference
\[
\omega \equiv \frac{dN}{dS} \equiv \frac{\hbox{rate of non-synonymous substitution}}{\hbox{rate of synonymous substitution}}
\]
but these rates need to be scaled to the neutral substitution process.
Productive vs. out-of-frame receptors
Each cell may carry two IGH alleles, but only one is expressed.

\[
\omega \equiv \frac{dN}{dS} \equiv \frac{\hbox{rate of non-synonymous substitution}}{\hbox{rate of synonymous substitution}}
\]

Out-of-frame reads can be used to infer neutral mutation rate!
\(\omega_l\) is a ratio of rates in terms of observed neutral process
- \(\lambda_l^{(N-I)}\): nonsynonymous in-frame rate for site \(l\)
- \(\lambda_l^{(N-O)}\): nonsynonymous out-of-frame rate for site \(l\)
- \(\lambda_l^{(S-I)}\): synonymous in-frame rate for site \(l\)
- \(\lambda_l^{(S-O)}\): synonymous out-of-frame rate for site \(l\)
\[
\omega_l = \frac{\lambda_l^{(N-I)} / \lambda_l^{(N-O)}}{\lambda_l^{(S-I)} / \lambda_l^{(S-O)}}
\]
Natural selection on “framework” region

Natural selection on “framework” region

Natural selection on “framework” region

Conclusion
B cell receptors are “drafted” and “revised” randomly, but
- … with remarkably consistent deletion and insertion patterns
… with remarkably consistent substitution and selection
We can learn about these processes using model-based inference.
Thank you
- National Science Foundation and National Institute of Health
- University of Washington Center for AIDS Research (CFAR)
- University of Washington eScience Institute
- Ralph & M. (2016). Consistency of VDJ Rearrangement and Substitution Parameters Enables Accurate B Cell Receptor Sequence Annotation. PLOS Computational Biology.
- Ralph & M. (2016). Likelihood-based inference of B-cell clonal families. arXiv, and in press, PLOS Computational Biology.
- McCoy, Bedford, Minin, Bradley, Robins, & M. (2015). Quantifying evolutionary constraints on B-cell affinity maturation. Phil Trans Royal Soc London (B).
http://matsen.group/ http://B-T.CR/
The hierarchical setup
- Substitution rate \(\lambda_s \sim \operatorname{Gamma}(\omega_c, \theta_c)\)
- Gamma mode \(\omega_c \sim \operatorname{Log-normal}(1, 1)\)
- Gamma dispersion \(\theta_c \sim \text{Lévy}(3)\)
- Stationary distribution \(\pi_s \sim \operatorname{Dirichlet}(3, 3, 3, 3)\)
- Branch length \(t \sim \operatorname{Exponential}(0.1)\)
Points = rates; triangles = 95% CI of fit prior
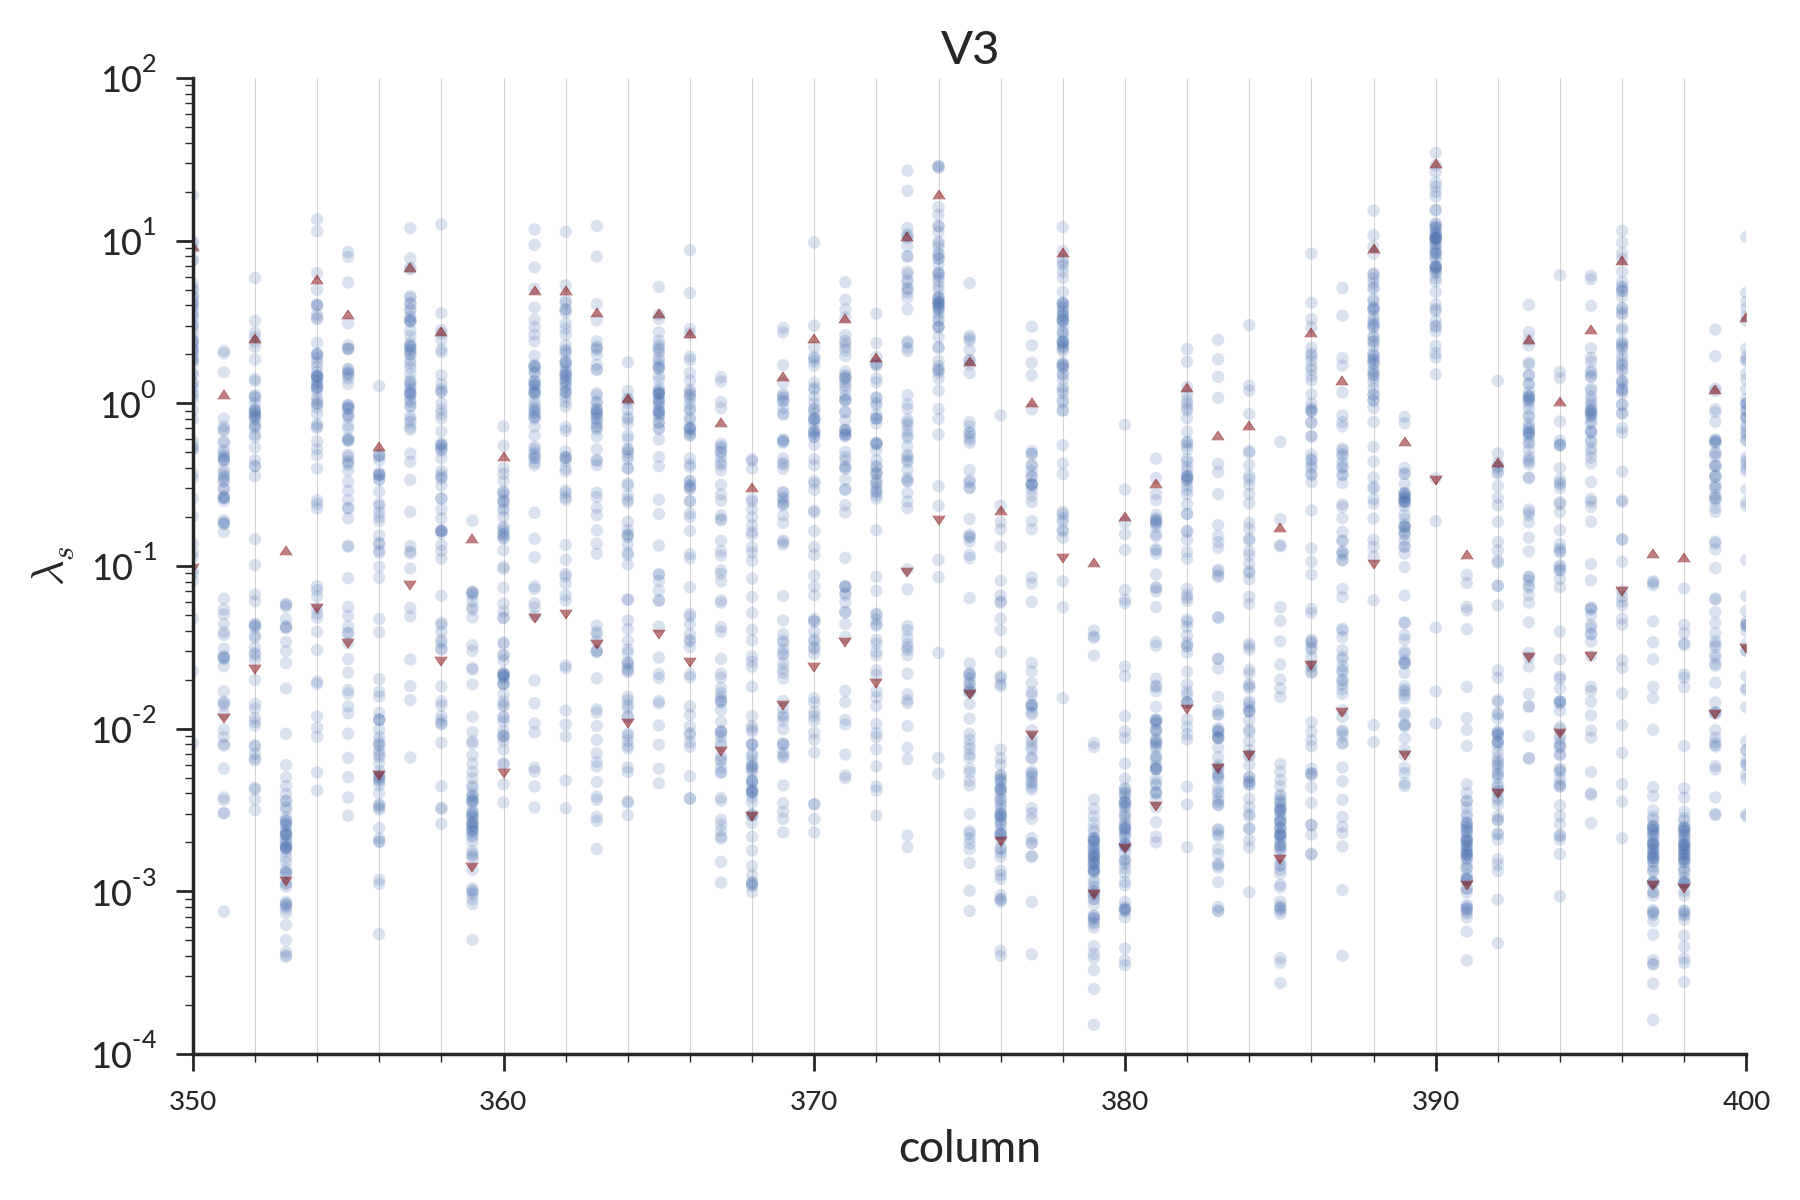
Points = rates; triangles = 95% CI of fit prior
Are fit priors actually helpful?
-
Hold out data from three very frequently observed genes:
IGHV3-23D, IGHV4-61, and IGHV5-51
-
Infer “gold standard” parameters for the three genes with a fit prior and, separately, a fixed prior using these data. Set aside.
-
Fit parameters for the data set using progressively more held-out data using a fit and a fixed prior.
-
Which one is closer to its gold-standard value?
Data from Adaptive Biotechnologies.
Fit priors are helpful for < 1000 reads


Tree principal components plot:
Points are germline genes.
Genes are positioned according to a principal coordinates projection of the within host evolution of that gene.
Note: the phylogenetic structure does not directly influence the position of the points.
Data: Adaptive individual A, subset to genes with 5000 or more observations
Random facts
- Mean length of D segment in individual A’s naive repertoire is 16.61.
- Subject A’s naive sequences were 37% CDR3
- Divergence between the various germ-line V genes:
> summary(dist.dna(allele_01, pairwise.deletion=TRUE, model='raw'))
Min.  1st Qu.   Median     Mean  3rd Qu.     Max.
0.003846 0.201300 0.344600 0.304700 0.384900 0.539500


